

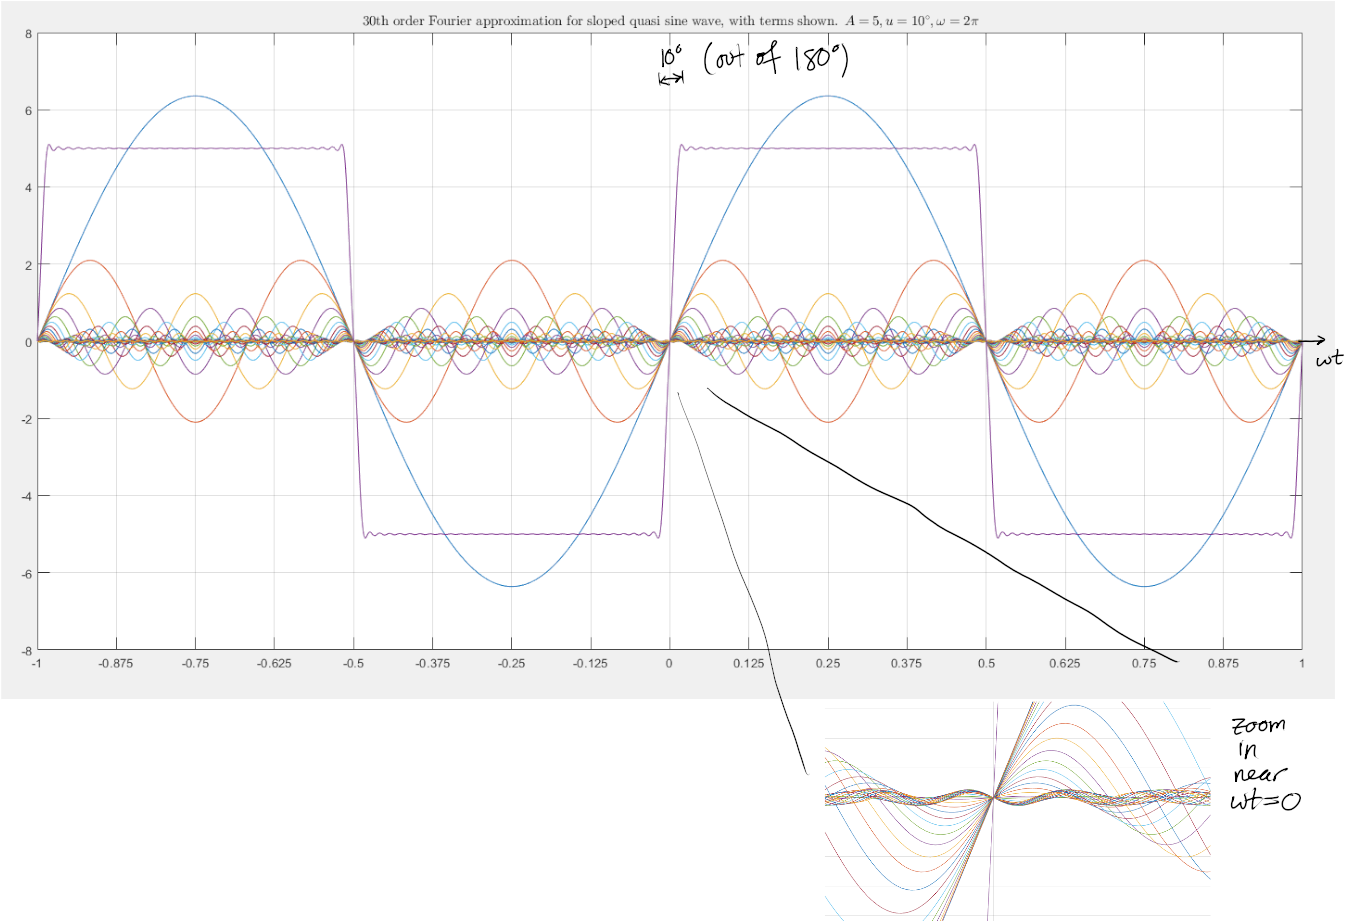
This is about representing a function as a sum of sine waves of varying frequencies (frequency is related to how long it takes them to do a full wiggle; specifically it's 1/timeToWiggle). If you add all the other waves up, you get the purple one.
This way of breaking the function down into the smoother "sine" waves is known as the Fourier series for the function. It's very relevant in the study of electricity, because the classic electrical components--resistors, capacitors, and inductors-- are all "linear", which in this case means they do not alter the frequency of voltage or current, when that voltage or current is a sine wave.
While they don't speed or slow the frequencies of the individual "harmonics", inductors and capacitors affect pure sine waves differently, depending on the frequency of the sine wave (capacitors make it harder for low-frequency signals to get through, inductors make it harder for high-frequency signals to get through). To figure out what a circuit using them does to something that isn't a sine wave, you need to represent it as a sum of sine waves and add up what it does to all of those little parts.
This is important because in many cases, voltages generated by electronic devices are neither perfectly flat DC signals, nor nice smooth sine waves. Say, a buck converter which steps down a 12V DC source to supply only 5V. It doesn't do so by acting as a constant 5V source; rather it turns on and off with a certain calculatable frequency so as to act as an "effective" 5 volt source (over a given time period, it delivers the same power a 5V source would, this is the sense in which it is "effectively" 5V). It will probably look something like our purple graph (but everything shifted to 0 or above).
Because the components affect all of these individual frequencies differently, you can end up with really nasty current waveforms that have very jagged features compared to nice, smooth sine waves. For devices connected to the grid, these jagged current "harmonics" affect the voltage on the grid, when they draw power via such strange currents.
The ability to decompose an arbitrary period signal into a sum of a potentially-infinite number of sine waves is something Fourier developed, and is depicted in the graph here. It allows us to understand these distortions and even design filters to make them less extreme, if we know have specific sources of disturbances in mind and know, in advance, the type of deformations that are likely to result.
LED lights, for example, need to include fancy circuitry to turn AC into DC (a "rectifier"), and ideally a filter to try and smooth out the current waveform drawn by the bulb.
Fourier was definitely a shithead though (wikipedia):
Fourier accompanied Napoleon Bonaparte on his Egyptian expedition in 1798, as scientific adviser, and was appointed secretary of the Institut d'Égypte. Cut off from France by the British fleet, he organized the workshops on which the French army had to rely for their munitions of war. He also contributed several mathematical papers to the Egyptian Institute (also called the Cairo Institute) which Napoleon founded at Cairo, with a view of weakening British influence in the East. After the British victories and the capitulation of the French under General Menou in 1801, Fourier returned to France.